How to Build a Simple Sales Dashboard in Google Sheets
Build a Google Sheets sales dashboard from transaction data. Filter paid orders, summarize branches and products, add a chart, and reconcile sample totals.
A simple sales dashboard can begin with one consistent transaction table, two summaries, and a chart. Define sales first. In this exercise, sales means transaction value marked Lunas (paid), rather than every order received.
Download the sample workbook. All data are fictional. It contains Data and Ringkasan (summary) sheets using SUMIFS and an Excel chart. You will create native Google Sheets pivots separately.
Check the source before charting
Data contains 12 transactions in A1:F13: ID, Tanggal (date), Cabang (branch), Produk (product), Total, and Status. Two cancelled records, labeled Batal, remain deliberately so you can check the filter.
Total is the transaction amount in IDR. Do not multiply it by quantity again. IDs should be unique at transaction level and dates should sort correctly. If orders span multiple product rows, establish how to count orders separately from rows.
Open a copy in Google Sheets
Upload the workbook to Drive and open it with Google Sheets. If it remains in Excel editing mode, save a native Google Sheets copy. Retain the download as the sample source.
Spot-check three transactions after import. Confirm that amounts remain numeric and dates retain their meaning. The sample headers are Indonesian; menu labels follow your account language.
Summarize branches
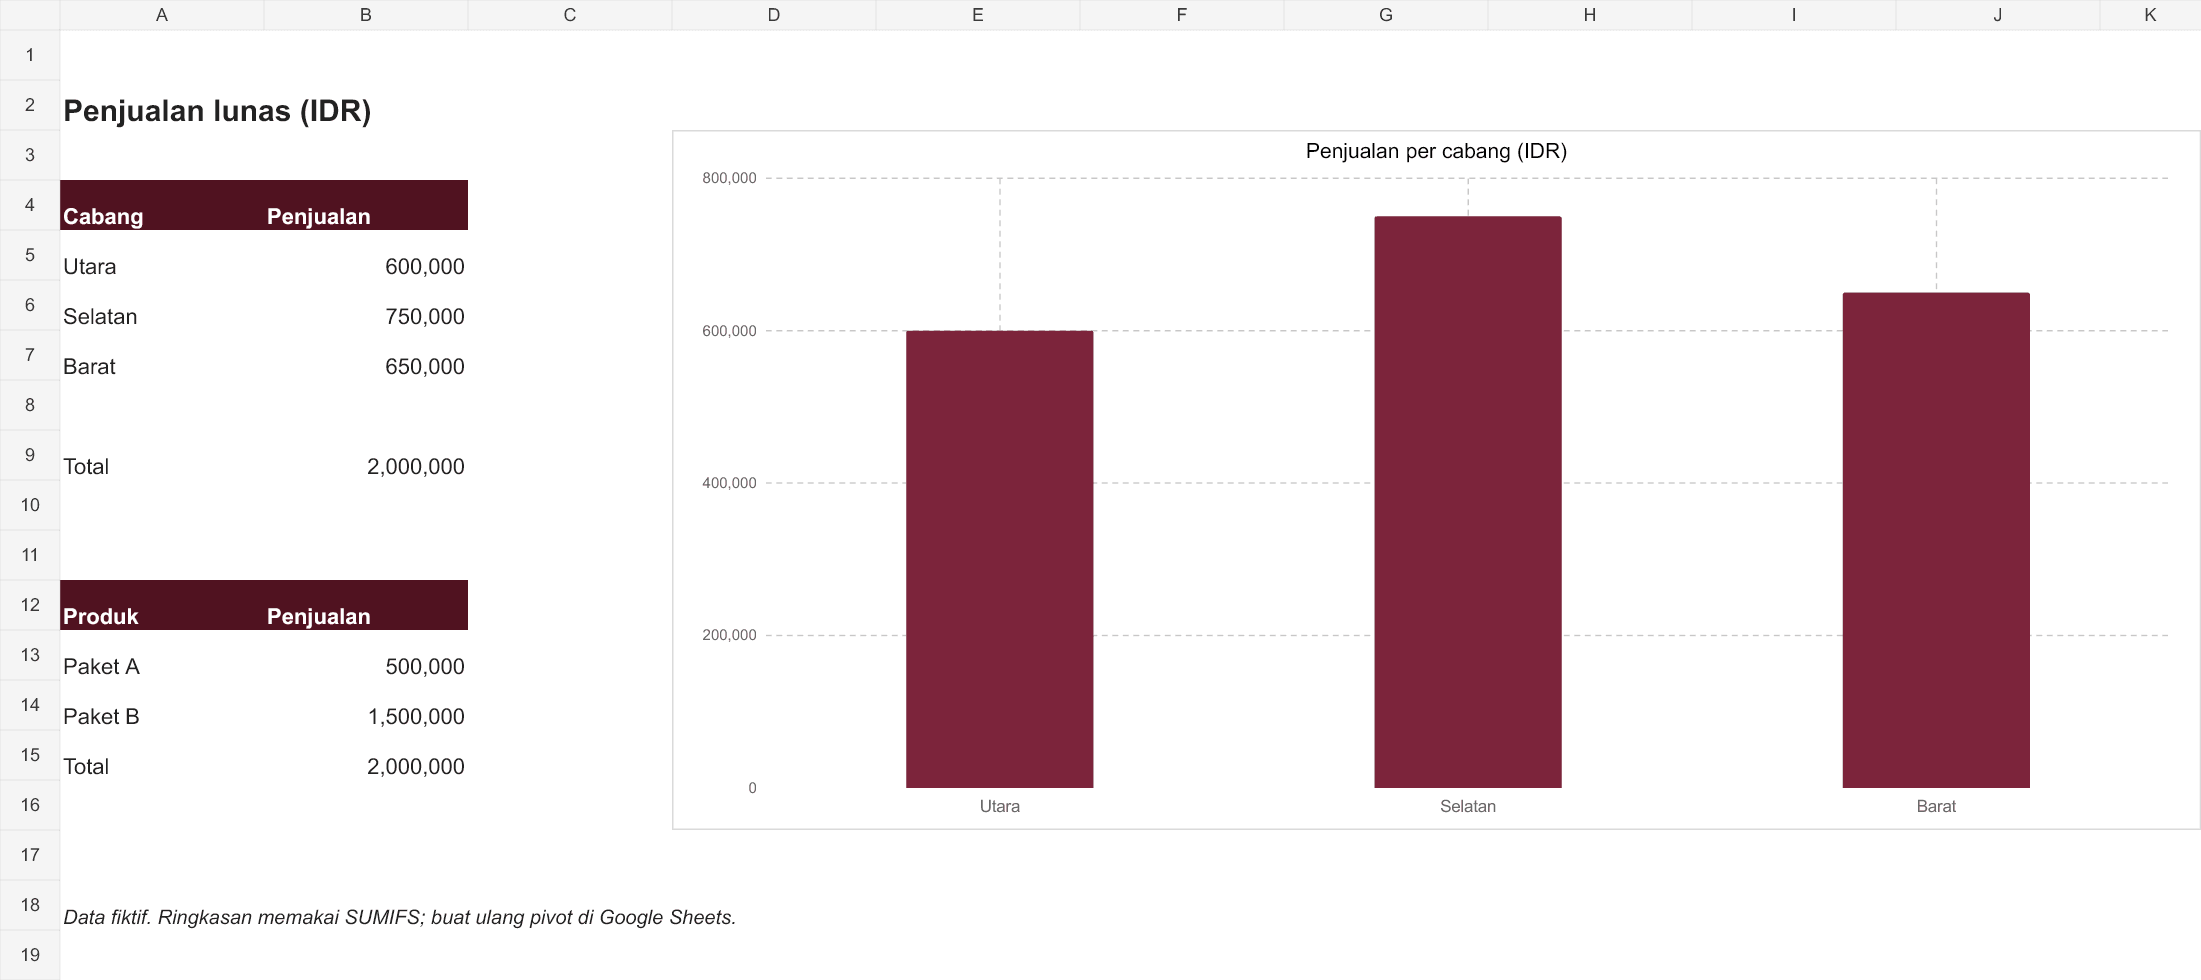
Select Data!A1:F13, then choose Insert → Pivot table. Add Cabang to Rows, Total to Values summarized by SUM, and Status as a Filter selecting only Lunas.
Google's pivot guide explains row, value, and filter configuration. COUNT counts populated values rather than adding sales amounts.
| Branch | Paid sales |
|---|---|
| Utara | IDR 600,000 |
| Selatan | IDR 750,000 |
| Barat | IDR 650,000 |
| Total | IDR 2,000,000 |
Add products and a chart
Create another summary using Produk as Rows, Total as SUM, and the same paid-status filter. Paket A totals IDR 500,000 and Paket B totals IDR 1,500,000. Together they must equal IDR 2,000,000.
For the branch chart, select branch names and values without the grand total row, then use Insert → Chart. Choose a column or bar chart with a zero-based value axis. Label the units so readers do not confuse Rupiah amounts with order counts.
Test one change
In your practice copy, change D001 from IDR 100,000 to IDR 200,000. Paid sales should become IDR 2,100,000, with Utara at IDR 700,000. Restore the original amount afterward.
If nothing changes, check the pivot source and available refresh behavior. Adding a transaction outside A1:F13 requires extending the source. A dashboard can look normal while omitting new records.
Assign update ownership
State the reporting period and identify who checks the source before sharing. Separate permission to edit transactions from permission to view the dashboard where appropriate. Hiding the source sheet does not replace access controls.
For sources spread across files, start with combining records and checking duplicates. For MySQL sources, see scheduled synchronization to Sheets.
For a dashboard that needs recurring updates from existing systems, tell me where the data live and what decisions the report should support.
Cover photo: Carlos Muza on Unsplash, used under the Unsplash License. This is an illustrative stock photo, not documentation of the incident, featured product, or a test result.
Is your team still doing something by hand?
Tell me about it, and let's find the fix together.
More notes
Unexpected AI Bills? Understand LLMJacking and Stolen Access
LLMJacking abuses access to AI and cloud services, driving unexpected bills. Learn the warning signs, alert versus limit differences, and how to respond.
Read the note
How to Back Up a Website in cPanel Before Updating PHP
Back up website files and databases in cPanel before a PHP update. Understand full and partial backups, off-server copies, and how to plan a website recovery.
Read the note